After Identifiying Opportunities, a few questions still remain:
- How effective are the analysis methods and resulting metrics in predicting returns on investments?
- What is the optimal expected return on an investment?
- How long should an investment be held?
These are questions that we answer at Prime Cognos using event studies. The image below presents a simple example of an event study:
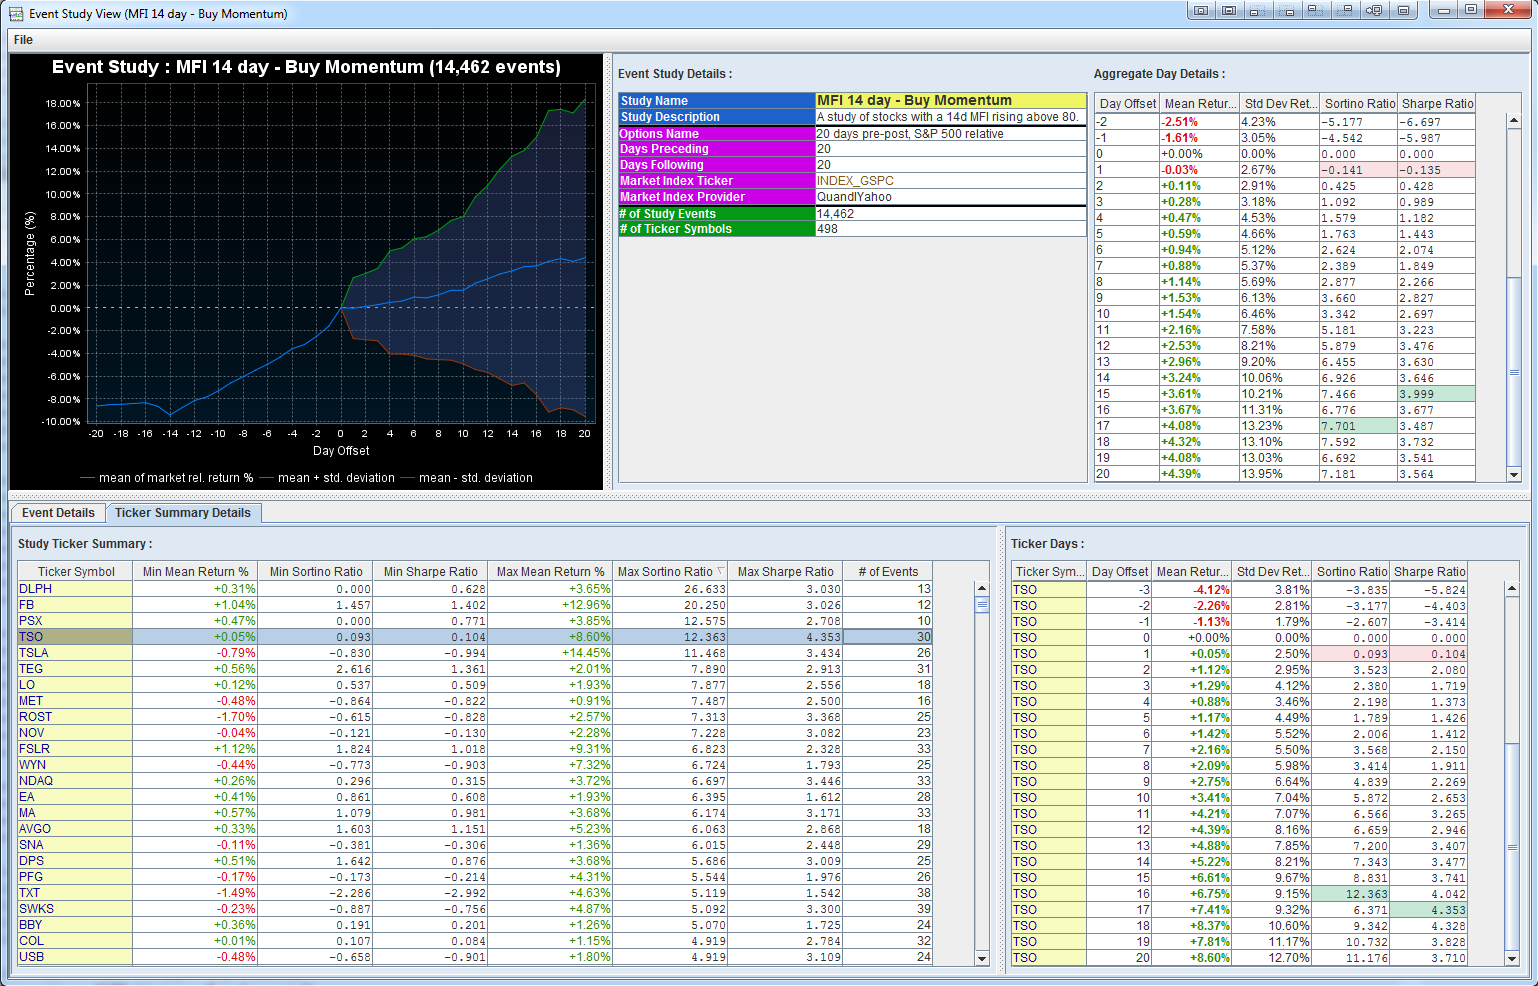
This example shows the effectiveness of the MFI technical indicator against stocks that comprise the S&P 500 index between 2005 and 2015.
Quantitative analysis is the application of mathematics (statistics, probability theory, calculus, etc) onto financial markets. In practice, quantitative analysis relies heavily on computers to perform the necessary calculations to produce the metrics used in financial forecasting and risk analysis.
The image below shows some of the quantitative analysis tooling used by Prime Cognos software and services:
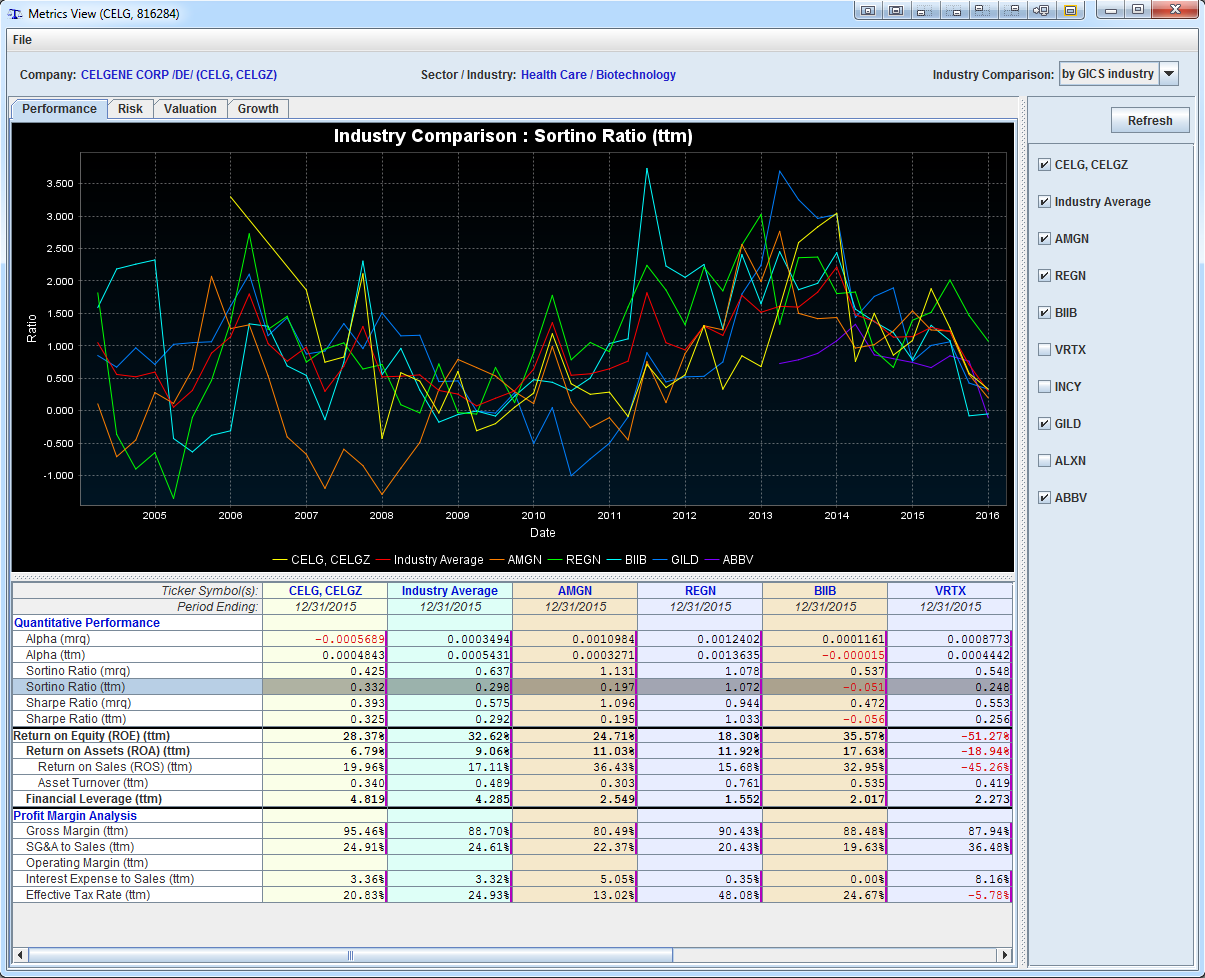
Each investment is quantitatively evaluated across four core aspects:
- Performance
- Risk
- Valuation
- Growth
They are also evaluated against their industry peers and against themselves historically. We'll continue by detailing some of the more interesting quantitative analysis metrics.
Sharpe Ratio
The Sharpe Ratio is a measure for calculating risk-adjusted return, and this ratio has become the industry standard for such calculations. It was developed by Nobel laureate William F. Sharpe. The Sharpe ratio is the average return earned in excess of the risk-free rate per unit of volatility or total risk. Subtracting the risk-free rate from the mean return, the performance associated with risk-taking activities can be isolated. One intuition of this calculation is that a portfolio engaging in “zero risk” investment, such as the purchase of U.S. Treasury bills (for which the expected return is the risk-free rate), has a Sharpe ratio of exactly zero. Generally, the greater the value of the Sharpe ratio, the more attractive the risk-adjusted return.
Sortino Ratio
The Sortino Ratio is a modification of the Sharpe ratio that differentiates harmful volatility from general volatility by taking into account the standard deviation of negative asset returns, called downside deviation. The Sortino ratio subtracts the risk-free rate of return from the portfolio’s return, and then divides that by the downside deviation. A large Sortino ratio indicates there is a low probability of a large loss.
Determining whether to use the Sharpe ratio or Sortino ratio depends on whether the investor wants to focus on standard deviation or downside deviation. Sharpe ratios are better at analyzing portfolios that have low volatility because the Sortino ratio won’t have enough data points to calculate downside deviation. This makes the Sortino ratio better when analyzing highly volatile portfolios.
Return On Assets (ROA)
Return on assets (ROA) is an indicator of how profitable a company is relative to its total assets. ROA gives an idea as to how efficient management is at using its assets to generate earnings. Calculated by dividing a company's annual earnings by its total assets, ROA is displayed as a percentage.
ROA tells you what earnings were generated from invested capital (assets). ROA for companies can vary substantially and will be highly dependent on the industry. At Prime Cognos we use ROA as a metric to compare a company's management efficiencies against its previous ROA numbers and against the ROA of similar companies in its industry.
Technical Analysis is used to identify directional characteristics of an investment through the study of historical price and volume data. In this section we will detail some of the technical indicators used at Prime Cognos to determine investment opportunities and entry/exit points.
The image below shows some of the technical indicators used by Prime Cognos software and services:
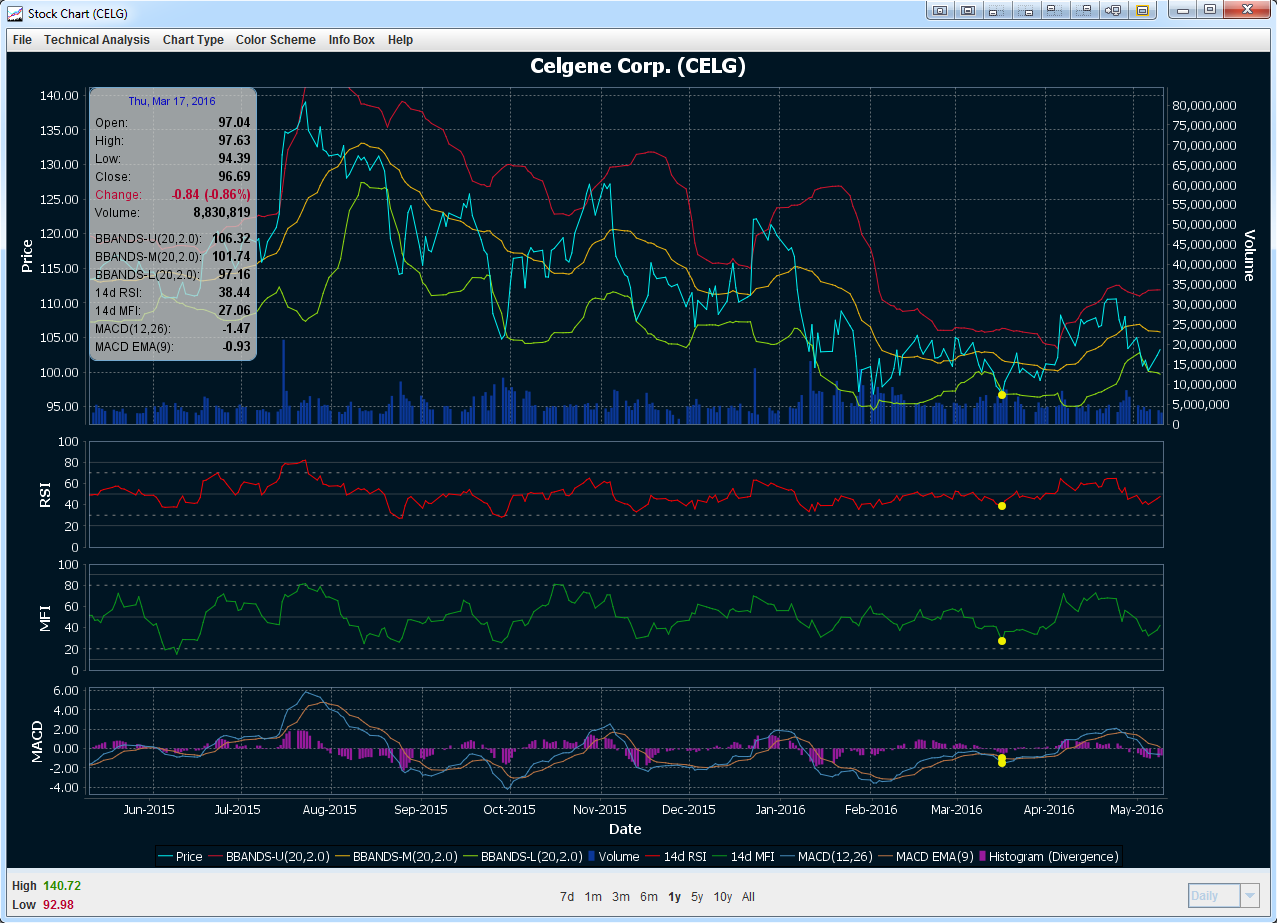
Our software can programmatically interpret and detect opportunities derived from the technical indicators. We'll continue by detailing each of the technical indicators below.
Bollinger Bands (BBANDS)
Bollinger Bands is a technical indicator invented by John Bollinger in the 1980s. Having evolved from the concept of trading bands, Bollinger Bands are used to measure the "highness" or "lowness" of the price relative to previous trades.
Bollinger Bands consist of:
- an N-period moving average (MA)
- an upper band at K times an N-period standard deviation above the moving average (MA + Kσ)
- a lower band at K times an N-period standard deviation below the moving average (MA − Kσ)
Typical values for N and K are 20 and 2, respectively.
Prices are high at the upper band and low at the lower band. BBANDS can aid in pattern recognition and is useful in comparing price action to the action of the indicator.
Relative strength index (RSI)
The relative strength index (RSI) is a technical indicator used to chart the current and historical strength or weakness of an investment based on the closing prices of a recent trading period. The RSI is a momentum oscillator, measuring the velocity and magnitude of directional price movements. Momentum is the rate of the rise or fall in price. The RSI computes momentum as the ratio of higher closes to lower closes: stocks which have had more or stronger positive changes have a higher RSI than stocks which have had more or stronger negative changes.
The RSI is most typically used on a 14-day timeframe, measured on a scale from 0 to 100, with high and low levels marked at 70 and 30, respectively. Shorter or longer timeframes are used for alternately shorter or longer outlooks. More extreme high and low levels — 80 and 20, or 90 and 10 — occur less frequently but indicate stronger momentum.
Money flow index (MFI)
The money flow index (MFI) is an oscillator that ranges from 0 to 100. It is used to show the money flow (an approximation of the dollar value of a day's trading) over several days. MFI is used to measure the "enthusiasm" of the market. In other words, the money flow index shows how much a stock was traded.
A value of 80 or more is generally considered overbought, a value of 20 or less oversold. Divergences between MFI and price action are also considered significant, for instance if price makes a new rally high but the MFI is less than its previous high then that may indicate a weak advance that is likely to reverse.
Moving average convergence/divergence (MACD)
MACD, short for moving average convergence/divergence, is a trading indicator used to reveal changes in the strength, direction, momentum, and duration of a trend in a stock's price.
The MACD indicator is a collection of three time series calculated from historical price data, most often the closing price. These three series are: the MACD series proper, the "signal" or "average" series, and the "divergence" series which is the difference between the two. The MACD series is the difference between a "fast" (short period) exponential moving average (EMA), and a "slow" (longer period) EMA of the price series. The average series is an EMA of the MACD series itself.
The MACD and average series are customarily displayed as continuous lines in a plot whose horizontal axis is time, whereas the divergence is shown as a bar graph (often called a histogram).
A fast EMA responds more quickly than a slow EMA to recent changes in a stock's price. By comparing EMAs of different periods, the MACD series can indicate changes in the trend of a stock. The divergence series can reveal subtle shifts in the stock's trend.
Fundamental analysis of a business involves analyzing its financial statements to determine its health, management performance, and its relative positioning to its competitors and industry.
The image below shows some of the fundamental analysis tooling used by Prime Cognos software and services:
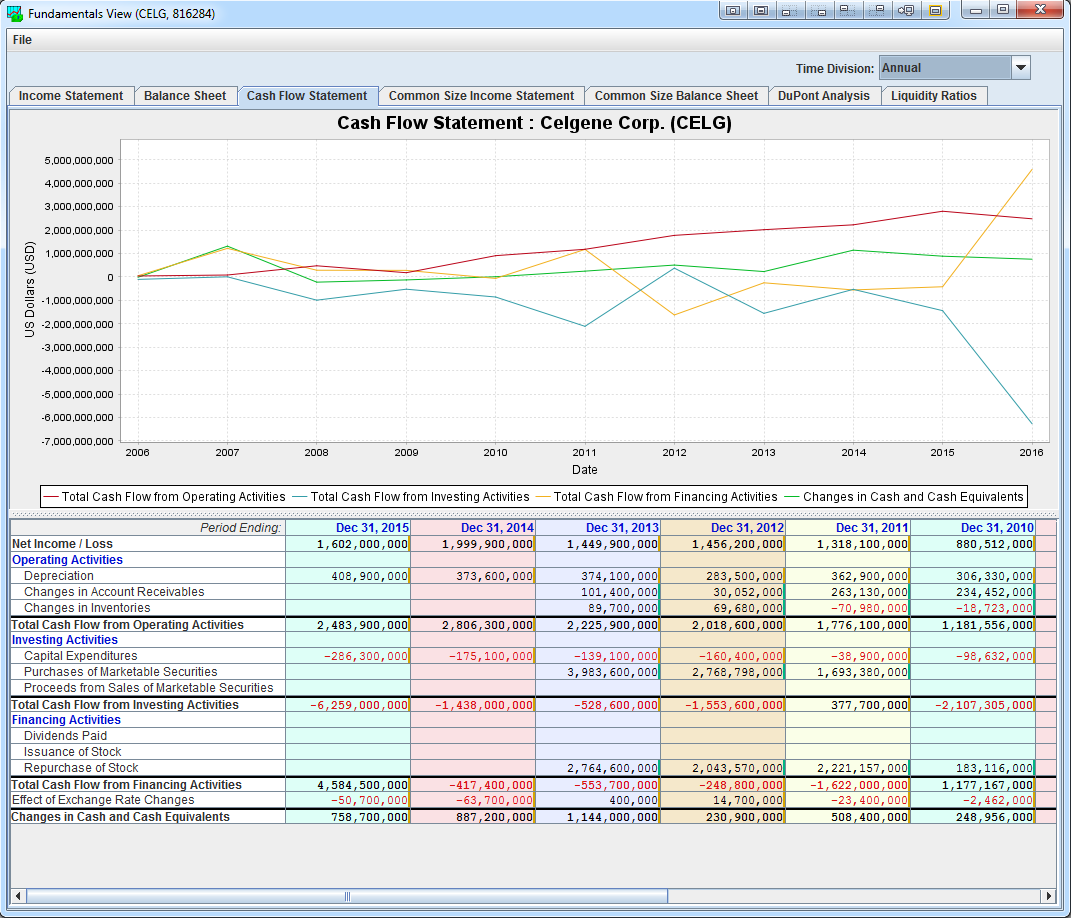
Our software can programmatically interpret and detect opportunities derived from fundamental analysis. We'll continue by detailing some of the more interesting aspects of fundamental analysis below.
Cash flow from operating activities (CFO)
Cash flow from operating activities (CFO) is a measure of the amount of cash generated by a company's normal business operations. CFO is important because it indicates whether a company is able to generate sufficient positive cash flow to maintain and grow its operations, or whether it may require external financing. OCF is calculated by adjusting net income for items such as depreciation, changes to accounts receivable, and changes in inventory.
CFO strips away certain accounting effects and is thought to provide a clearer picture of the current reality of the business operations.
Capital expenditures (CapEx)
Capital expenditures, or CapEx, are funds used by a company to acquire or upgrade physical assets such as property, industrial buildings or equipment. It is often used to undertake new projects or investments by the firm. This type of outlay is also made by companies to maintain or increase the scope of their operations. These expenditures can include everything from repairing a roof to building, to purchasing a piece of equipment, or building a brand new factory.
If a company has the financial ability to invest in itself through capital expenditure, it is easier for the company to grow. It is important to note that this is an industry specific ratio and is compared to other companies that have similar CapEx requirements.
At Prime Cognos we monitor a company's CapEx relative its depreciation expense. Companies with CapEx less than their depreciation are generally ones on the decline.
Repurchase of Stock
Share repurchase is usually an indication that the company's management thinks the shares are undervalued. The company can buy shares directly from the market or offer its shareholder the option to tender their shares directly to the company at a fixed price.
Because a share repurchase reduces the number of shares outstanding, it increases earnings per share and tends to elevate the market value of the remaining shares. At Prime Cognos we analyze how much earnings growth is from share repurchases versus how much of it is from sales and margin growth.
In Portfolio Composition we went over some basic portfolio theory. Then in Financial Risks we detailed a variety of investment risks. In this section and its subsections we'll discuss how to identify investments with potential opportunities.
There are a number of ways in which to identify investment opportunities. Below are some of the common analysis methods that we discuss further in their corresponding subsections:
- Technical Analysis - the analysis of price and volume information to identify liquidity, momentum, trends, and reversals
- Fundamental Analysis - the analysis of financial statements to identify valuation, performance, and credit risks
- Quantitative Analysis - the statistical analysis (with computational assistance) of market data to identify metrics such as risk adjusted performance
(each bullet point is a clickable link to a detailed subsection)
The creation (or capturing) of CAPM alpha (described in Portfolio Composition) is driven by using these methods of analysis.
- You are here:
-
Home

- Financial Education Series