Technical Analysis is used to identify directional characteristics of an investment through the study of historical price and volume data. In this section we will detail some of the technical indicators used at Prime Cognos to determine investment opportunities and entry/exit points.
The image below shows some of the technical indicators used by Prime Cognos software and services:
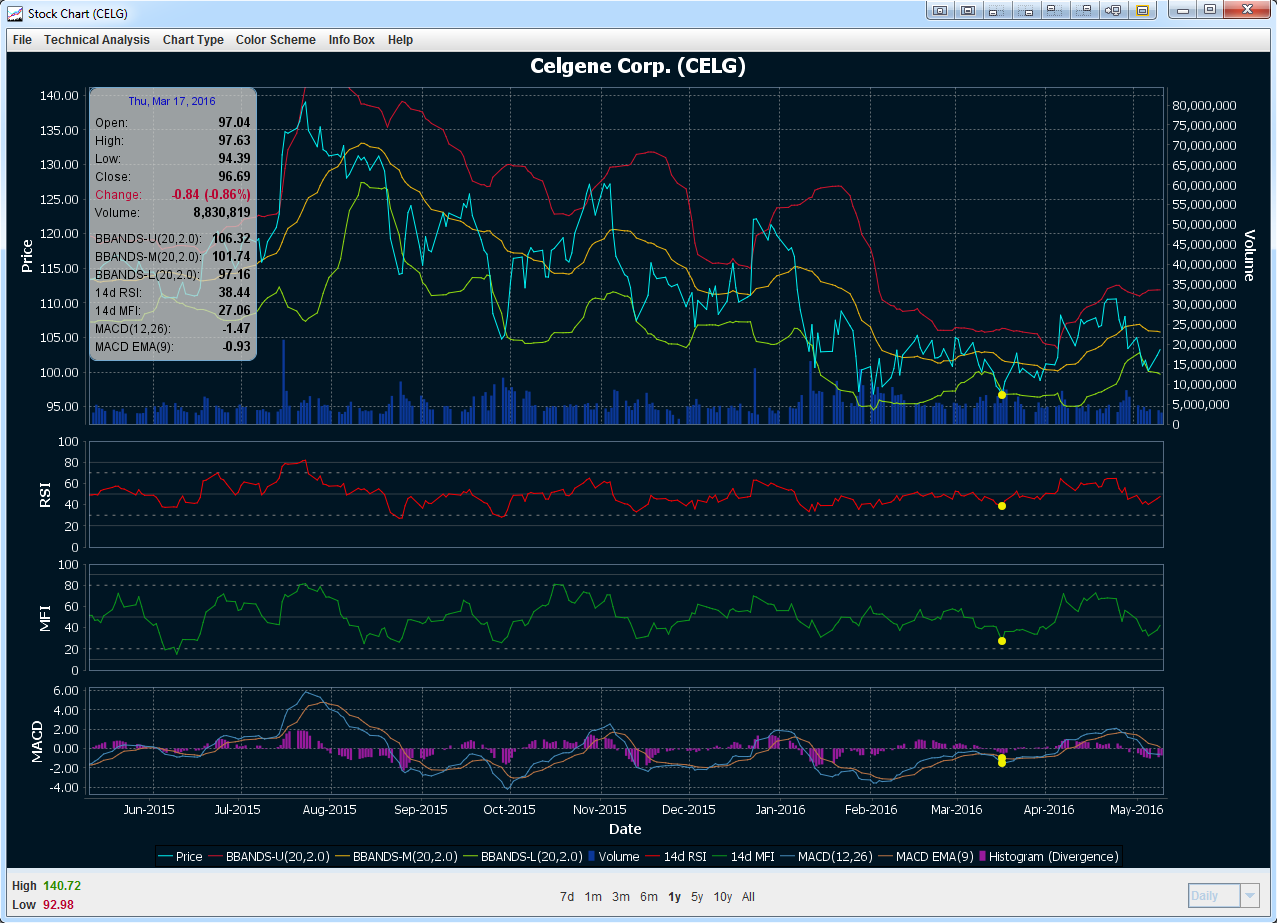
Our software can programmatically interpret and detect opportunities derived from the technical indicators. We'll continue by detailing each of the technical indicators below.
Bollinger Bands (BBANDS)
Bollinger Bands is a technical indicator invented by John Bollinger in the 1980s. Having evolved from the concept of trading bands, Bollinger Bands are used to measure the "highness" or "lowness" of the price relative to previous trades.
Bollinger Bands consist of:
- an N-period moving average (MA)
- an upper band at K times an N-period standard deviation above the moving average (MA + Kσ)
- a lower band at K times an N-period standard deviation below the moving average (MA − Kσ)
Typical values for N and K are 20 and 2, respectively.
Prices are high at the upper band and low at the lower band. BBANDS can aid in pattern recognition and is useful in comparing price action to the action of the indicator.
Relative strength index (RSI)
The relative strength index (RSI) is a technical indicator used to chart the current and historical strength or weakness of an investment based on the closing prices of a recent trading period. The RSI is a momentum oscillator, measuring the velocity and magnitude of directional price movements. Momentum is the rate of the rise or fall in price. The RSI computes momentum as the ratio of higher closes to lower closes: stocks which have had more or stronger positive changes have a higher RSI than stocks which have had more or stronger negative changes.
The RSI is most typically used on a 14-day timeframe, measured on a scale from 0 to 100, with high and low levels marked at 70 and 30, respectively. Shorter or longer timeframes are used for alternately shorter or longer outlooks. More extreme high and low levels — 80 and 20, or 90 and 10 — occur less frequently but indicate stronger momentum.
Money flow index (MFI)
The money flow index (MFI) is an oscillator that ranges from 0 to 100. It is used to show the money flow (an approximation of the dollar value of a day's trading) over several days. MFI is used to measure the "enthusiasm" of the market. In other words, the money flow index shows how much a stock was traded.
A value of 80 or more is generally considered overbought, a value of 20 or less oversold. Divergences between MFI and price action are also considered significant, for instance if price makes a new rally high but the MFI is less than its previous high then that may indicate a weak advance that is likely to reverse.
Moving average convergence/divergence (MACD)
MACD, short for moving average convergence/divergence, is a trading indicator used to reveal changes in the strength, direction, momentum, and duration of a trend in a stock's price.
The MACD indicator is a collection of three time series calculated from historical price data, most often the closing price. These three series are: the MACD series proper, the "signal" or "average" series, and the "divergence" series which is the difference between the two. The MACD series is the difference between a "fast" (short period) exponential moving average (EMA), and a "slow" (longer period) EMA of the price series. The average series is an EMA of the MACD series itself.
The MACD and average series are customarily displayed as continuous lines in a plot whose horizontal axis is time, whereas the divergence is shown as a bar graph (often called a histogram).
A fast EMA responds more quickly than a slow EMA to recent changes in a stock's price. By comparing EMAs of different periods, the MACD series can indicate changes in the trend of a stock. The divergence series can reveal subtle shifts in the stock's trend.