In Portfolio Composition we described market risk and how to minimize it in a portfolio. In this section we'll discuss other types and measures of financial risk.
The software and services created at Prime Cognos are designed to measure and minimize exposure to a variety of financial risks. The image below shows some of these measures of risk:
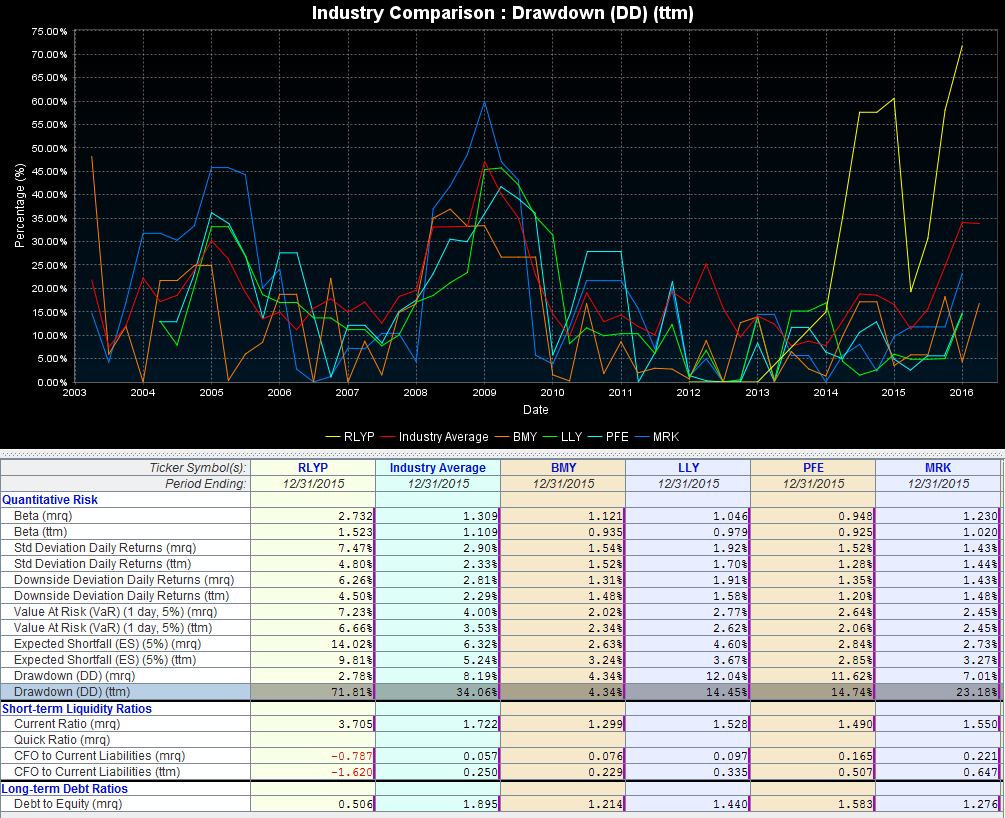
As you can see there are a number of different risk metrics and a wide range of values within each individual metric. We'll continue by detailing each of the metrics and their implications in the construction of portfolios.
Standard Deviation of Returns
The most common risk measure used in investment risk evaluation is standard deviation. Standard deviation in this case is the level of volatility of returns measured in percentage terms. Standard deviation gives a good indication of the variability of returns and makes it easy to compare to other investments. For example, if comparing two investments with identical annualized returns, the investment with a lower standard deviation would normally be more attractive, if all else is equal.
Downside Deviation of Returns
Unfortunately standard deviation does not capture the total risk picture of returns. This is because most investments do not have normally distributed returns, and a regular standard deviation assumes a bell-shaped distribution, which assumes the same probability of returns being above the mean as below the mean. Accordingly, as far as investments risk are concerned, investors tend to worry more about down-side risk then up-side risk. To this end, downside deviation is calculated by taking the standard deviation on days where daily returns are at a loss.
Value at Risk (VaR)
Value at Risk (VaR) is a widely used risk measure of the risk of loss on an investment. For a given investment, time horizon, and probability p, the p VaR is defined as a threshold loss value, such that the probability that the loss on the investment over the given time horizon exceeds this value is p. This assumes mark-to-market pricing, and no trading in the investment.
For example, if an investment has a one-day 5% VaR of a 10% loss, there is a 0.05 probability that the portfolio will fall in value by more than 10% over a one day period if there is no trading. Informally, a 10% loss or more on this portfolio is expected on 1 day out of 20 days (because of the 5% probability). A loss which exceeds the VaR threshold is termed a "VaR break."
Expected Shortfall (ES)
Expected shortfall (ES) is an alternative to value at risk that is more sensitive to the shape of the loss distribution in the tail of the distribution. The "expected shortfall at q% level" is the expected return on the portfolio in the worst q% of the cases.
ES evaluates the risk of an investment in a conservative way, focusing on the less profitable outcomes. For high values of q it ignores the most profitable but unlikely possibilities, for small values of q it focuses on the worst losses. A value of q often used in practice is 5%.
Drawdown (DD)
Drawdown (DD) is the peak-to-trough decline during a specific record period of an investment. A drawdown is usually quoted as the percentage between the peak and the trough. It is measured from the time a retrenchment begins to when a new high is reached. This method is used because a valley can't be measured until a new high occurs. Once the new high is reached, the percentage change from the old high to the smallest trough is recorded.
Drawdown is a good metric for identifying investments that preserve wealth by minimizing losses throughout up/down cycles, and gives a good indication of the possible losses that an investment can experience at any given point in time.
Current Ratio
The current ratio is a short-term liquidity ratio that measures a firm's ability to pay off its short-term liabilities with its current assets. The current ratio is an important measure of liquidity because short-term liabilities are due within the next year.
This means that a company has a limited amount of time in order to raise the funds to pay for these liabilities. Current assets like cash, cash equivalents, and marketable securities can easily be converted into cash in the short term. This means that companies with larger amounts of current assets will more easily be able to pay off current liabilities when they become due without having to sell off long-term, revenue generating assets.
The current ratio is calculated by dividing current assets by current liabilities. Current assets and current liabilities are retrieved from a company's balance sheet.
CFO to Current Liabilities Ratio
The CFO to Current Liabilities ratio is a measure of how well current liabilities are covered by the cash flow generated from a company's operations. It can gauge a company's liquidity in the short term. Using cash flow as opposed to income is sometimes a better indication of liquidity simply because, as we know, cash is how bills are normally paid off.
Debt to Equity Ratio
The debt to equity ratio is a liquidity ratio that compares a company's total debt to total equity. The debt to equity ratio shows the percentage of company financing that comes from creditors and investors. A higher debt to equity ratio indicates that more creditor financing (bank loans) is used than investor financing (shareholders).
The debt to equity ratio is calculated by dividing total liabilities by total equity. The debt to equity ratio is considered a balance sheet ratio because all of the elements are reported on the balance sheet.
A lower debt to equity ratio usually implies a more financially stable business. Companies with a higher debt to equity ratio are considered more risky to creditors and investors than companies with a lower ratio. Unlike equity financing, debt must be repaid to the lender. Since debt financing also requires debt servicing or regular interest payments, debt can be a far more expensive form of financing than equity financing. Companies leveraging large amounts of debt might not be able to make the payments.