Quantitative analysis is the application of mathematics (statistics, probability theory, calculus, etc) onto financial markets. In practice, quantitative analysis relies heavily on computers to perform the necessary calculations to produce the metrics used in financial forecasting and risk analysis.
The image below shows some of the quantitative analysis tooling used by Prime Cognos software and services:
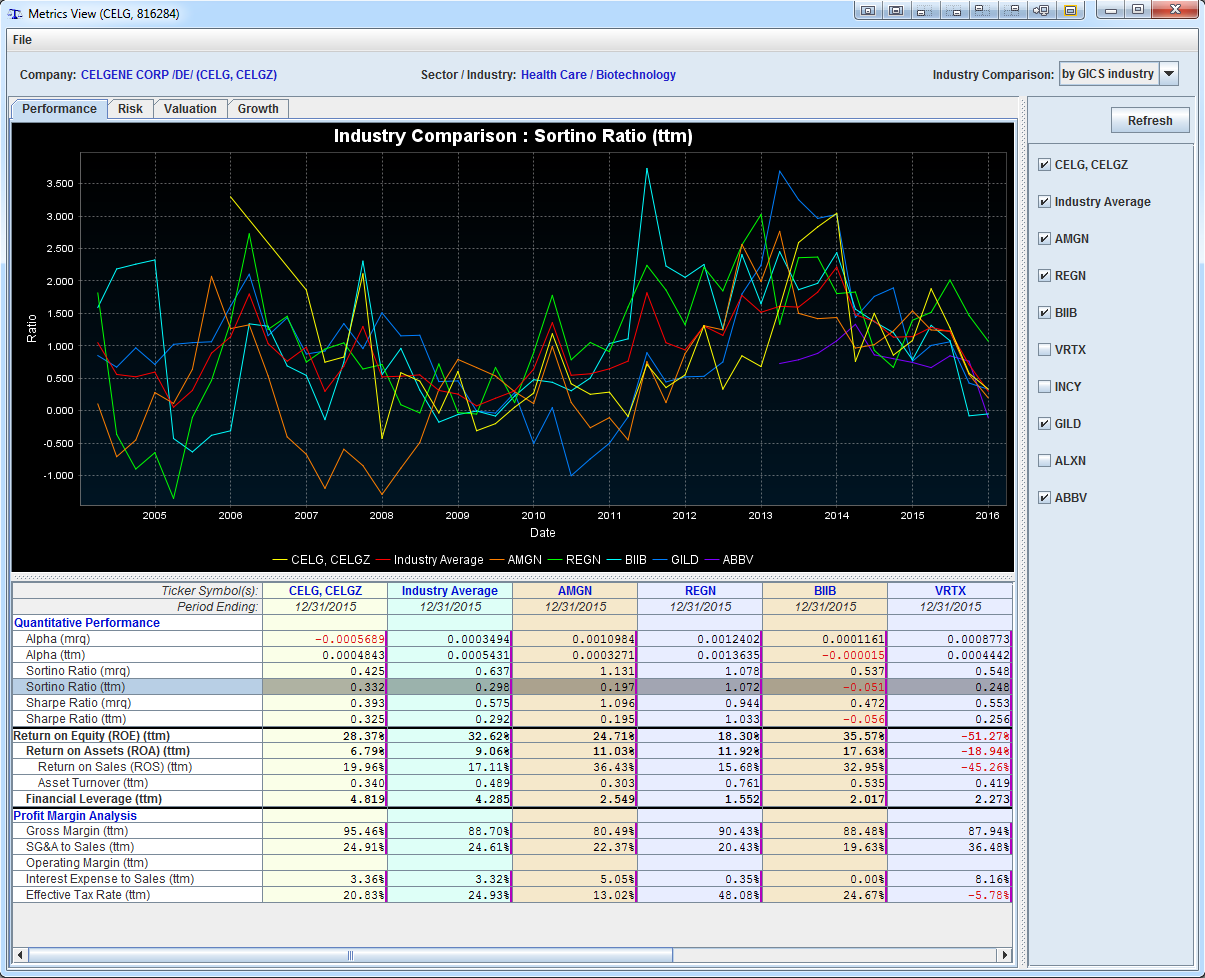
Each investment is quantitatively evaluated across four core aspects:
- Performance
- Risk
- Valuation
- Growth
They are also evaluated against their industry peers and against themselves historically. We'll continue by detailing some of the more interesting quantitative analysis metrics.
Sharpe Ratio
The Sharpe Ratio is a measure for calculating risk-adjusted return, and this ratio has become the industry standard for such calculations. It was developed by Nobel laureate William F. Sharpe. The Sharpe ratio is the average return earned in excess of the risk-free rate per unit of volatility or total risk. Subtracting the risk-free rate from the mean return, the performance associated with risk-taking activities can be isolated. One intuition of this calculation is that a portfolio engaging in “zero risk” investment, such as the purchase of U.S. Treasury bills (for which the expected return is the risk-free rate), has a Sharpe ratio of exactly zero. Generally, the greater the value of the Sharpe ratio, the more attractive the risk-adjusted return.
Sortino Ratio
The Sortino Ratio is a modification of the Sharpe ratio that differentiates harmful volatility from general volatility by taking into account the standard deviation of negative asset returns, called downside deviation. The Sortino ratio subtracts the risk-free rate of return from the portfolio’s return, and then divides that by the downside deviation. A large Sortino ratio indicates there is a low probability of a large loss.
Determining whether to use the Sharpe ratio or Sortino ratio depends on whether the investor wants to focus on standard deviation or downside deviation. Sharpe ratios are better at analyzing portfolios that have low volatility because the Sortino ratio won’t have enough data points to calculate downside deviation. This makes the Sortino ratio better when analyzing highly volatile portfolios.
Return On Assets (ROA)
Return on assets (ROA) is an indicator of how profitable a company is relative to its total assets. ROA gives an idea as to how efficient management is at using its assets to generate earnings. Calculated by dividing a company's annual earnings by its total assets, ROA is displayed as a percentage.
ROA tells you what earnings were generated from invested capital (assets). ROA for companies can vary substantially and will be highly dependent on the industry. At Prime Cognos we use ROA as a metric to compare a company's management efficiencies against its previous ROA numbers and against the ROA of similar companies in its industry.