Below you will find the historical performance and risk measures of Prime Cognos managed funds (as of 9/14/2017).
| Time Period | Fund (from fund incep.) |
S&P 500 (from fund incep.) |
Fund (2017 YTD) |
S&P 500 (2017 YTD) |
|---|---|---|---|---|
| Profit/Loss % | +33.80% | +19.89% | +10.22% | +11.68% |
| Sortino Ratio | 1.947 | 0.988 | 1.728 | 1.845 |
| Sharpe Ratio | 1.870 | 1.013 | 1.541 | 1.860 |
| Alpha | 0.0003318 | 0.0000000 | 0.0002992 | 0.0000000 |
| Beta | 0.5225154 | 1.0000000 | 0.4079759 | 1.0000000 |
| Time Period | Fund (2016) |
S&P 500 (2016) |
Fund (2015*) |
S&P 500 (2015*) |
|---|---|---|---|---|
| Profit/Loss % | +10.68% | +9.54% | +9.69% | -1.99% |
| Sortino Ratio | 0.848 | 0.742 | 1.282 | -0.079 |
| Sharpe Ratio | 0.904 | 0.761 | 1.078 | -0.079 |
| Alpha | 0.0001763 | 0.0000000 | 0.0005920 | 0.0000000 |
| Beta | 0.6425848 | 1.0000000 | 0.4358279 | 1.0000000 |
(* note: 2015 data measured from fund inception date of 4/30/2015)
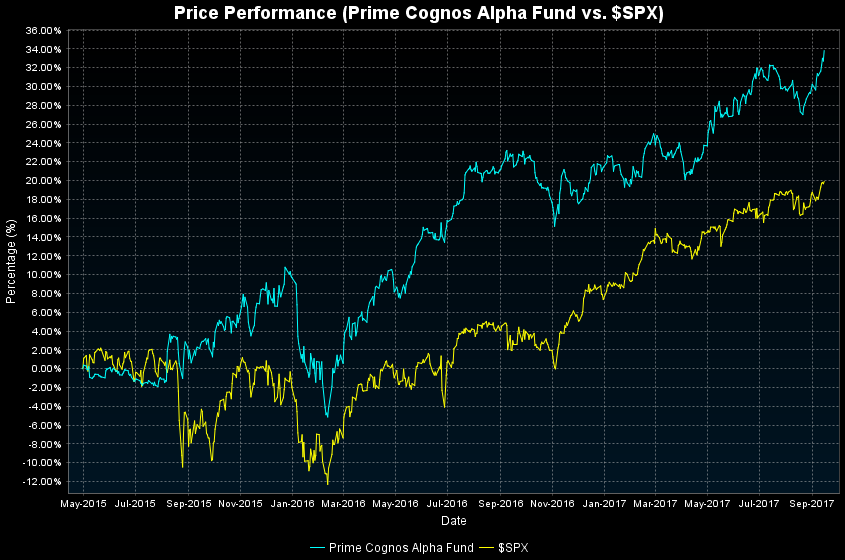
The historic price performance chart: